Coding the blocks
Zooming in
In my last post, I mentioned that I’m now counting individual pieces of litter I collect when cleaning up the streets of Capitol Hill in Denver, CO. This is thanks to the happy discovery of a mobile app called, “Delete Litter,” where the # of pieces collected is a data point when logging new cleanups.
I realized tracking this data gives me the ability to look at trends and test the theory that people are less likely to litter in a clean environment. So, I decided to be even more specific and targeted with my litter walks.
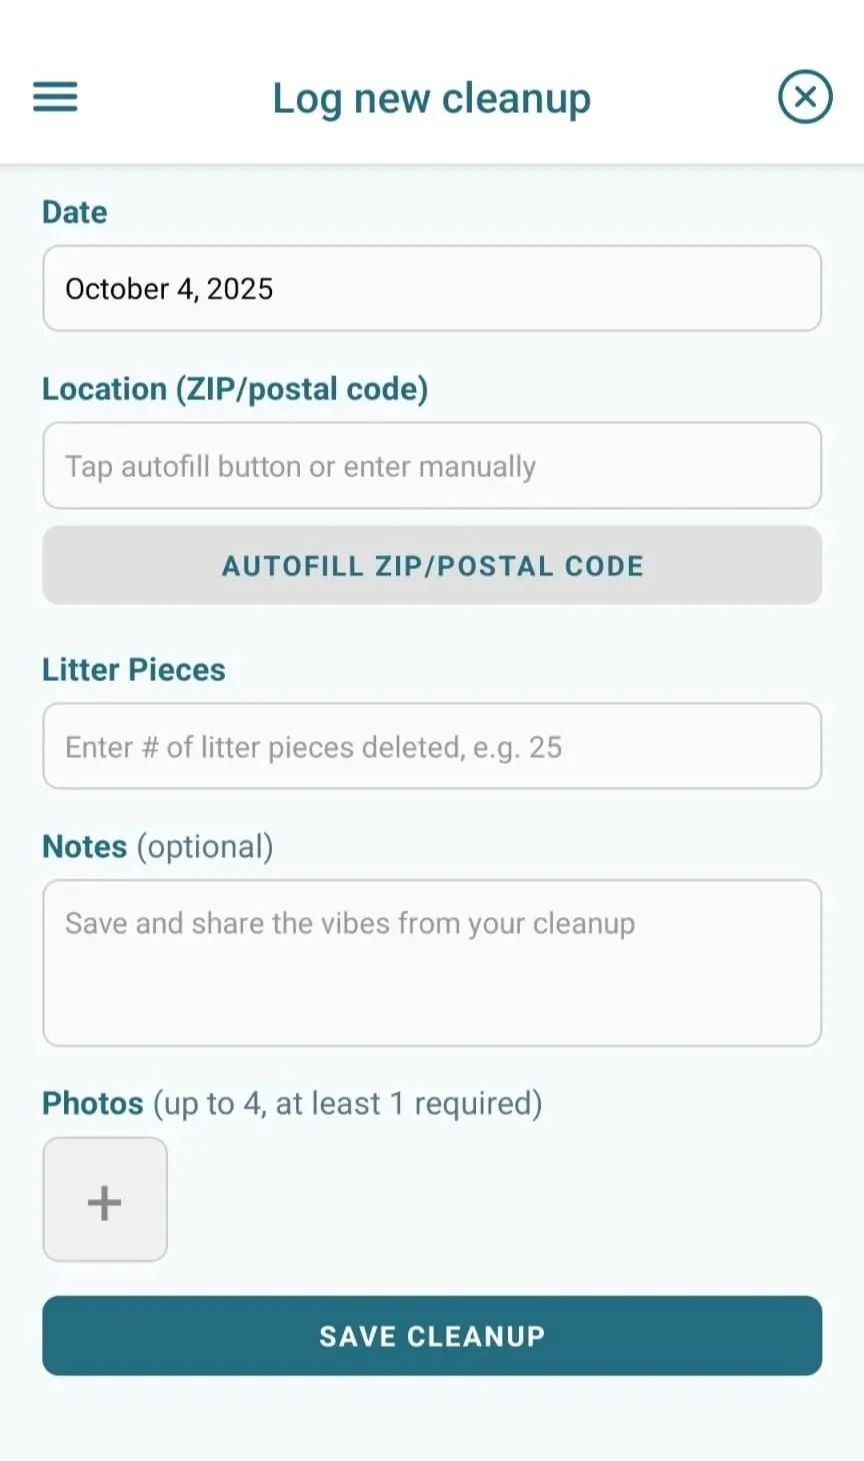
Screenshot of new cleanup entry in the Delete Litter mobile app.
Method

There are 96 blocks in the Capitol Hill neighborhood. For this phase of the experiment, I am going to focus on cleaning two blocks (~2%), tracking each block separately, and limiting myself to weekly pickups. Starting on one corner, I will make my way fully around the block and count how many pieces of litter I collected.
The purpose of this is to gather data on litter accumulation in a given week and to see what similarities and differences there are between two adjacent blocks in the northeast corner of the neighborhood.
To better visualize this, I created a grid system where each block has an alphanumeric code.
Figure 1: Map of Capitol Hill neighborhood boundaries, where each block is labeled with an alphanumeric code.
Research
I previously shared a little bit about Cialdini’s litter studies from the early 90’s which show a positive correlation between the amount of litter in an environment and littering behavior.

Like this.
In other words, people litter less in a clean environment compared to a littered environment.
His studies looked at social norms, namely:
Descriptive norms: the common or typical observed behavior in a given environment
Injunctive norms: the social expectations about how people should or should not behave
Questions
How frequently does an area need to be maintained, and for how long, before seeing a change in the descriptive norm?
Will a change in the descriptive norm be observed?
In the scenario where a change in the descriptive norm is observed, how “sticky” is the new anti-littering norm?
Data
As best I could, I coded my previous cleanups going back to early September when I started tracking in the DL app.
September 24 was the official start of implementing the more specific system for clean ups. Between weeks, it was tough to be on my daily walks and ignore the Big Gulps, the empty chip bags, the discarded shooters, the cigarette butts (the endless cigarette butts), and all the other pieces of litter that seem to inevitably accumulate in a given week. But in the name of science, I resisted.

The litter I had to endure seeing on my daily walks between cleanups.
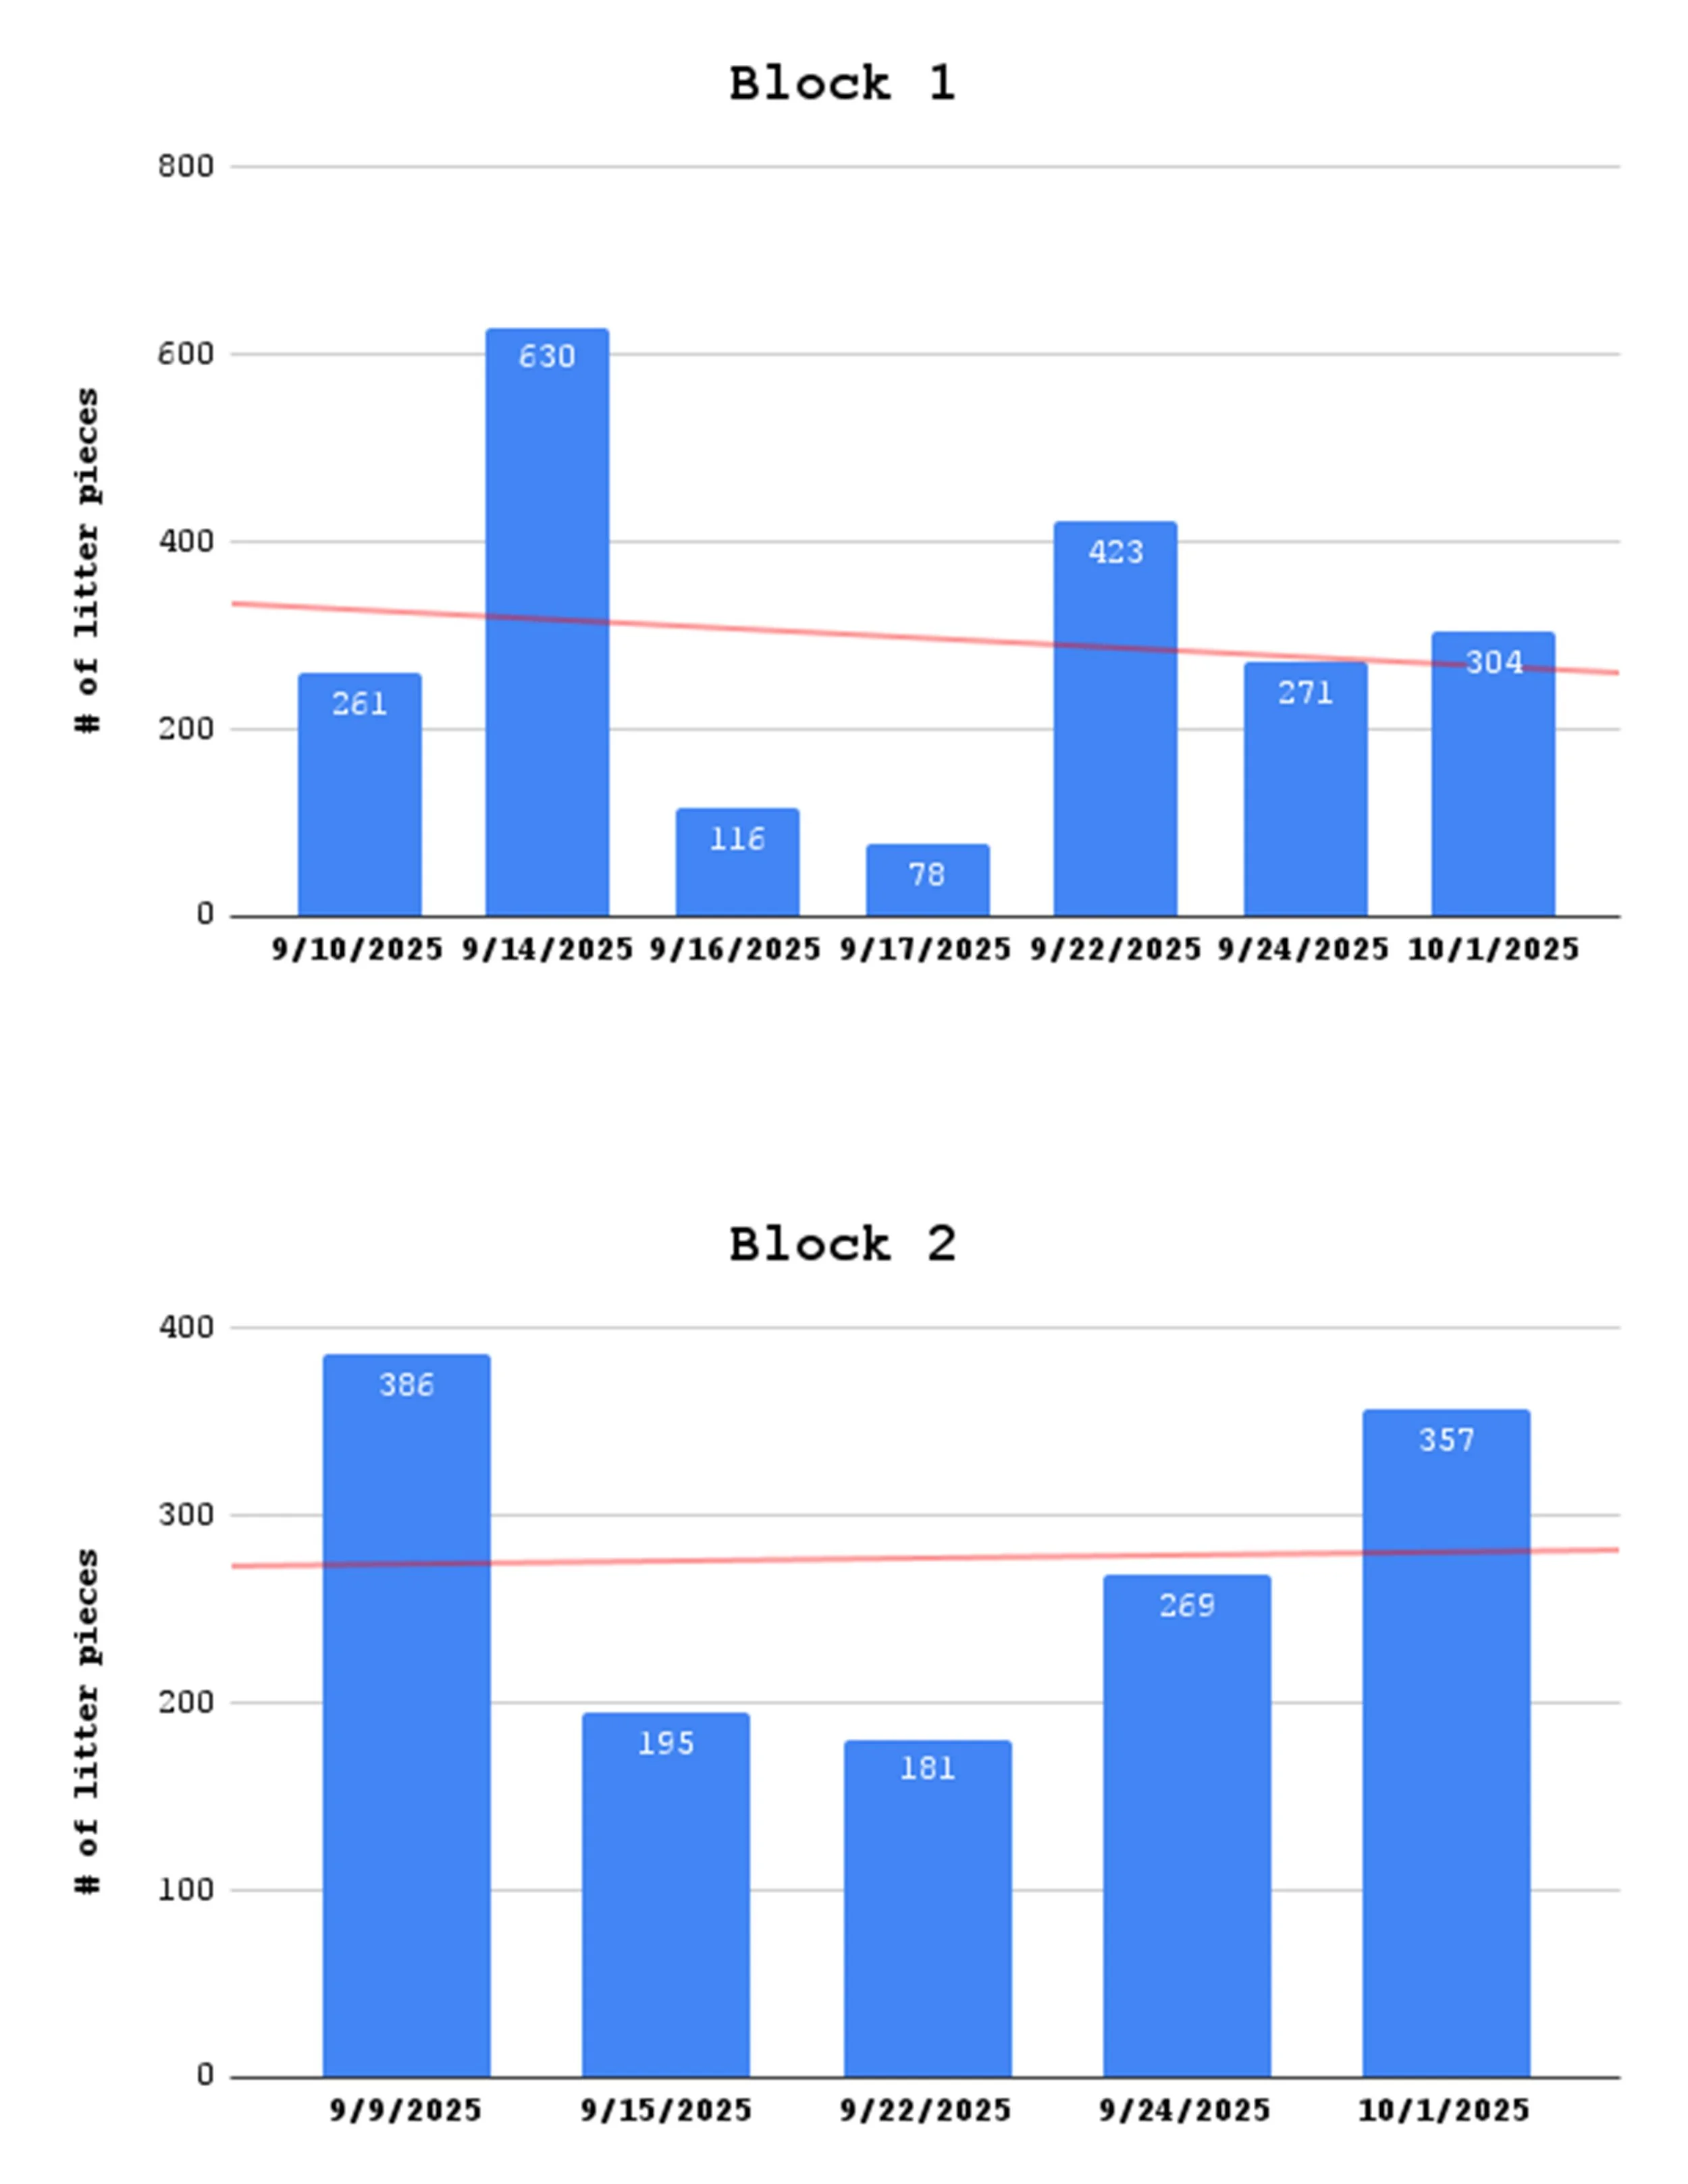
Figure 2: Number of litter pieces collected per block (Block 1, top and Block 2, bottom) since the start of counting individual pieces of litter - September 9, 2025.
On October 1, I got out there with my trash grabber, albeit its broken handle, and I developed a callous while picking up 661 pieces of trash.

Figure 3: The number of litter pieces collected per block, with one week between cleanups.
It’s interesting to see how the numbers were almost exactly the same for each block in the first week!
So far, it looks like littering is up, but I will need more data before I can see any type of trend.

If you’d like to follow along and stay connected, subscribe to my Substack, “Trash Talk.”
I’ll see you over there.